
Tracing Technical Analysis Roots
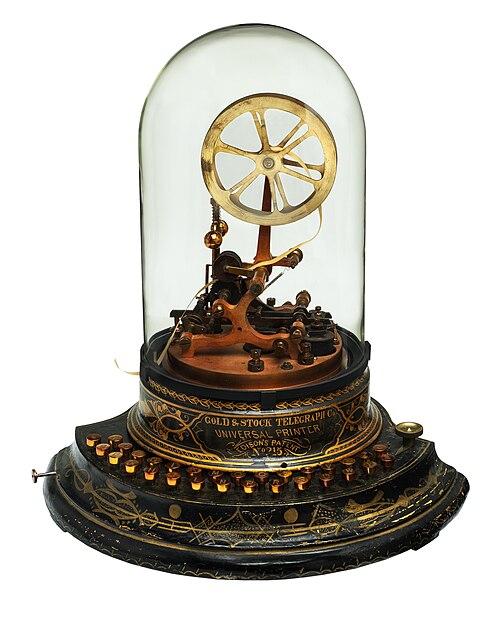
Credit:Wikipedia
Introduction: The Market’s Oldest Language
Imagine standing on the trading floor of a bustling exchange in the late 1800s. There are no computers, no economic dashboards, no AI-powered forecasts. Yet some traders consistently seem to know when a trend is beginning and when it is ending.
What were they seeing?
The answer lies in a simple but powerful observation: markets leave clues. Long before spreadsheets and algorithms, traders noticed that prices tend to move in recognizable patterns because human behavior tends to repeat itself. Fear, greed, optimism, and panic may wear different costumes in every era, but they continue to drive market movements.
More than two centuries after its earliest forms emerged, technical analysis remains one of the most widely used approaches in global financial markets. The reason is simple: while technologies evolve, human nature changes very little.
This observation became the foundation of technical analysis (TA)—a discipline often described as part science, part art. The science comes from studying historical price and volume data. The art comes from interpreting what those patterns reveal about crowd psychology.

Credit:unofficed.com
The First Market Detectives
The story begins in 18th-century Japan.
Rice trader Munehisa Homma faced the same challenge traders face today: uncertainty. While trading rice futures in Osaka, he observed that market prices were influenced not only by supply and demand but also by the emotions of buyers and sellers.
To track these shifts, Homma developed what would later become known as candlestick charts. Each candle captured the battle between buyers and sellers during a specific period. More than 250 years later, traders still use candlesticks to identify reversals, breakouts, and momentum shifts.
The remarkable part isn’t that the charts survived. It’s that they continue to work because they visualize something timeless: human behavior.
Charles Dow and the Birth of Trend Analysis
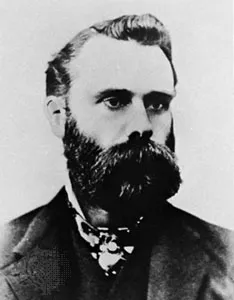
Fast-forward to the late nineteenth century. Journalist Charles Dow wasn’t trying to create a trading methodology. As co-founder of The Wall Street Journal, he wanted a way to measure the health of the economy. While studying market movements, Dow noticed that prices move in trends rather than random straight lines. These trends unfold in waves and reflect collective investor expectations.
His observations evolved into what became known as Dow Theory, introducing concepts that still form the backbone of modern technical analysis:
- Trends exist.
- Trends persst until evidence suggests otherwise.
- Volume confirms price movement.
- Markets discount available information.
Nearly every trend-following strategy today can trace its roots back to these principles.
Wyckoff: Reading the Footprints of Smart Money
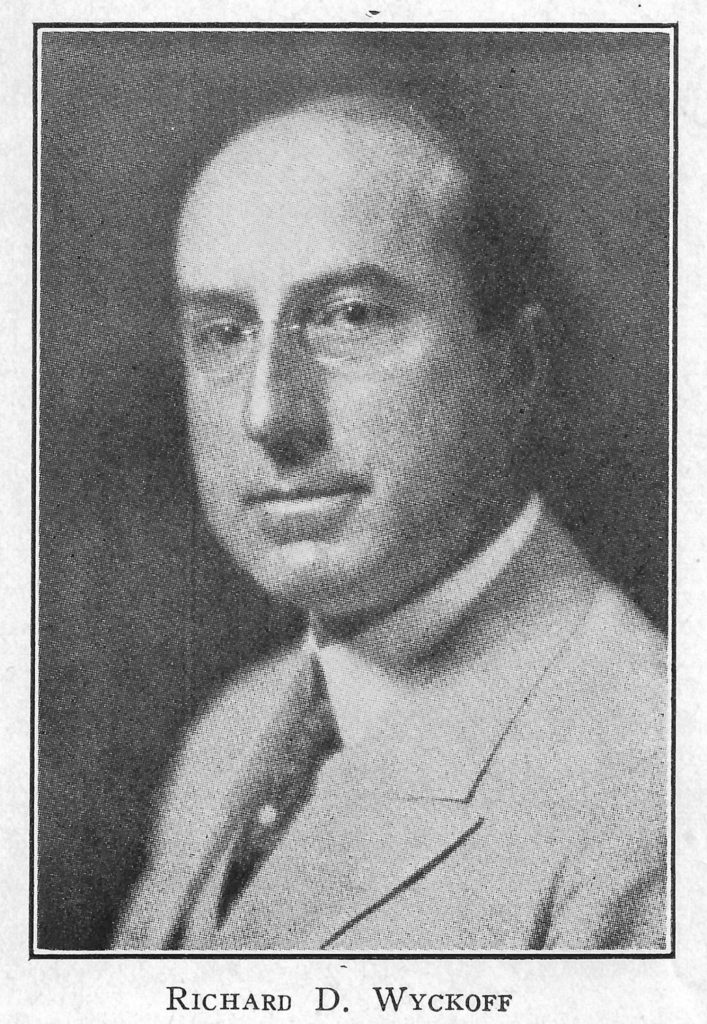
In the early twentieth century, Richard Wyckoff took technical analysis a step further.Rather than focusing only on price movements, Wyckoff studied the behavior of large institutional operators.
He believed markets moved through recurring phases of accumulation, markup, distribution, and markdown.His central insight was revolutionary:Markets are often driven by informed participants whose actions leave footprints in price and volume.
Modern concepts such as supply and demand zones, volume analysis, and market structure owe much to Wyckoff’s work. Even today’s algorithmic traders frequently incorporate variations of these principles into systematic models.

Elliott’s Search for Order in Chaos
During the 1930s, Ralph Nelson Elliott introduced one of the most debated theories in market history.
After studying decades of charts, Elliott proposed that markets move in recurring wave structures reflecting cycles of optimism and pessimism.
His Elliott Wave Principle suggested that collective psychology follows recognizable patterns across multiple timeframes.
While critics argue that wave counts can be subjective, Elliott’s work reinforced an important idea: market movements are not purely random. Instead, they often exhibit recurring behavioral rhythms.

The Rise of Indicators and Computerized Analysis
As computing power increased during the latter half of the twentieth century, technical analysis entered a new era.
Tools that once required manual calculations could suddenly be generated instantly.Moving averages became popular because they helped traders identify trend direction while filtering out noise. Oscillators such as RSI and MACD provided objective measures of momentum and potential reversals.
What had once been a chartist’s craft gradually evolved into a data-driven discipline.
Today, hedge funds, quantitative firms, and retail traders alike use sophisticated software to scan thousands of instruments for technical patterns in real time.
The methods have changed. The underlying logic has not.
Does Technical Analysis Actually Work?
This question has fueled decades of debate.Critics often argue that if markets are efficient, historical prices should offer little predictive value. Yet a substantial body of research suggests the reality is more nuanced.
One of the most influential studies was conducted by Brock, Lakonishok, and LeBaron (1992), who tested moving average and trading-range breakout rules on the Dow Jones Industrial Average. Their findings showed statistically significant predictive ability compared to random benchmarks.Subsequent studies across equities, currencies, commodities, and futures markets found similar evidence, particularly for trend-following approaches.A notable review by Park and Irwin (2007) examined nearly one hundred modern studies and reported that a majority found technical trading rules generated positive results under certain market conditions.
Perhaps the strongest evidence comes from trend-following strategies themselves. Research from firms such as AQR and studies on managed futures have documented long-term persistence in price trends across global asset classes.
The key takeaway is not that every indicator works.Rather, certain market behaviors—especially momentum and trend persistence—have repeatedly demonstrated predictive power.
Why Technical Analysis Still Matters in the Age of AI
At first glance, technical analysis seems outdated compared with machine learning and advanced quantitative models. Yet many modern algorithms are built upon technical concepts. Momentum factors, breakout systems, volatility models, and pattern-recognition engines often rely on information extracted directly from price action.
Even artificial intelligence must begin with data.Price remains one of the richest and most immediate forms of market information available.
Technical analysis therefore remains relevant not because it predicts the future perfectly, but because it helps traders interpret probabilities more effectively than intuition alone.
Three Historical Lessons You Can Apply Today
The greatest value of studying technical analysis history is not memorizing old theories. It is understanding the enduring principles that survived generations of market evolution.
The first lesson comes from Homma: watch market psychology. A candlestick pattern is valuable not because of its shape, but because it reveals a shift in buyer and seller behavior.
The second lesson comes from Dow: identify the trend before making predictions. Many trading mistakes occur when traders fight an established trend instead of working with it.
The third lesson comes from Wyckoff: pay attention to volume. Price tells you what happened. Volume often reveals how significant that move really was.
A practical exercise is surprisingly simple. Open a chart and add a 50-period moving average. Observe whether price is above or below it. Then identify recent highs and lows and compare volume during major moves. This basic framework incorporates principles developed over more than a century of market study.
Conclusion: An Evolving Craft Built on Timeless Human Behavior
From Japanese rice merchants to quantitative hedge funds, technical analysis has undergone extraordinary transformation. Candlesticks evolved into algorithms. Hand-drawn charts became machine-learning models.
Yet the central premise remains unchanged.Markets are collections of human decisions, and those decisions often leave recurring footprints.
Technical analysis is not a crystal ball. It cannot eliminate uncertainty or guarantee profits. What it can do is provide a structured framework for understanding how crowds behave, how trends emerge, and how opportunities develop.
That is why, despite centuries of innovation and countless predictions of its demise, technical analysis continues to thrive. It is not merely a study of charts. It is a study of people expressed through price.
- Homma, M. – The Fountain of Gold: The Three Monkey Record of Money
- Charles H. Dow – Collected Wall Street Journal Editorials
- Robert Rhea – The Dow Theory
- Richard D. Wyckoff – Studies in Tape Reading
- Ralph Nelson Elliott – The Wave Principle
- John J. Murphy – Technical Analysis of the Financial Markets
- Brock, Lakonishok & LeBaron (1992) – Simple Technical Trading Rules and the Stochastic Properties of Stock Returns
- Park & Irwin (2007) – What Do We Know About the Profitability of Technical Analysis?
- Andrew Lo, Harry Mamaysky & Jiang Wang (2000) – Foundations of Technical Analysis